
March 2018. Marin County home prices, appreciation rates, market statistics and trends.
Marin County Home Prices, Market Conditions & Trends
Strong Market Dynamics Continue into Early 2018
So far in 2018, the market seems to have mostly brushed aside concerns about increasing home prices, rising interest rates, stock market volatility and new federal tax law changes. It is still too early to come to definitive conclusions about where the year is going, but right now, in most market segments, buyer demand remains very strong for a limited supply of listings. This is especially true in the more affordable home segments, a dynamic playing out around the Bay Area. Of course, whatever the price segment, how buyers respond to a particular listing depends on the specific property and its location, appeal, preparation, marketing and pricing: Some listings sell very quickly, some only sell after price reductions, and, even in a hot market, some do not sell at all.
Home Value Appreciation
Year-over-Year Comparisons

The 16% year-over-year jump in median sales prices is unusually high and should probably be taken with a grain of salt until substantiated over a longer period of sales. The 7% increase in average dollar per square foot values is probably closer, but possibly a tad low as an indicator of recent home-value appreciation. (Median sales price and average price per square foot appreciation rates sometimes do not move in parallel when the mix of homes sold appreciably varies - for example, in average home size - from one period to the next.) What is indisputable is that significant market appreciation has continued over the past year, and perhaps accelerated over the last 4 or 5 months. We will know more once the spring selling season really gets going in earnest.
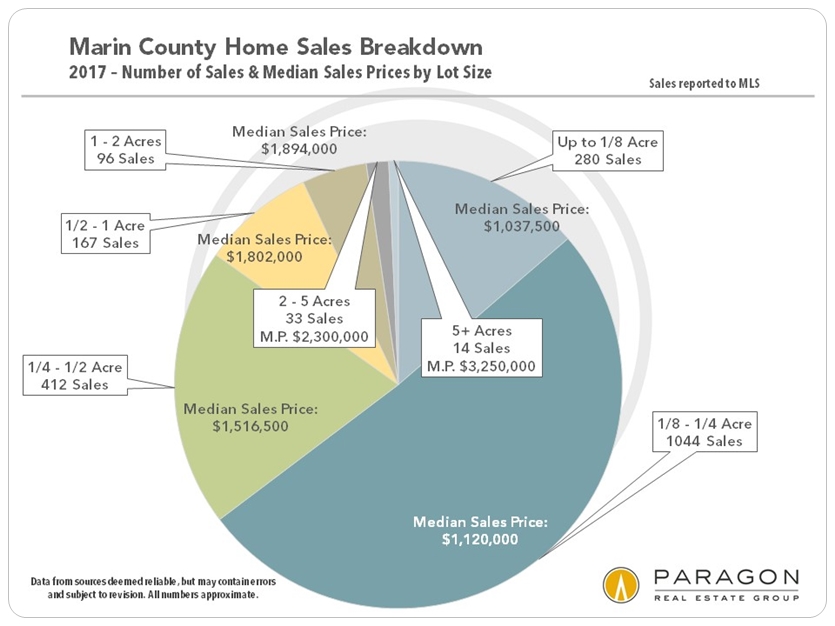
Home Values by Lot Size
In San Francisco, a house worth $1m can sit next to one worth $4m, each on its own narrow, 25-foot-wide, 2500 square foot lot, but in Marin, with more land to stretch out on, home values correlate to a surprising degree with lot size, as illustrated below. Which does not mean this applies to every home in the county, and of course, in Marin, considerable percentages of lots can consist of steep hillside land. Steep hillsides often bring lovely views, while, on the other hand, good-sized, flat yards are highly prized as well.
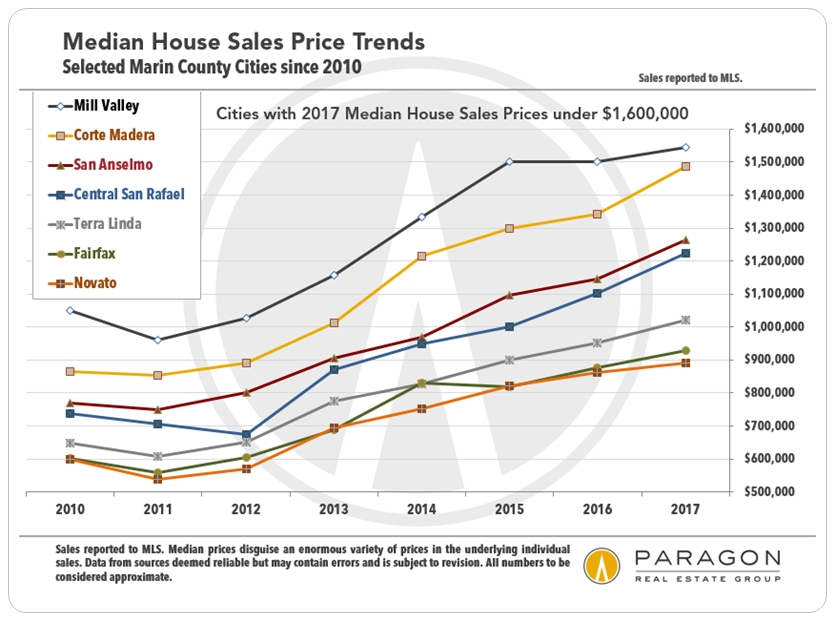
Appreciation by City & Town by Year
The next 3 charts look at house value appreciation in cities and towns around the area, from most affordable, to more expensive, to most expensive.
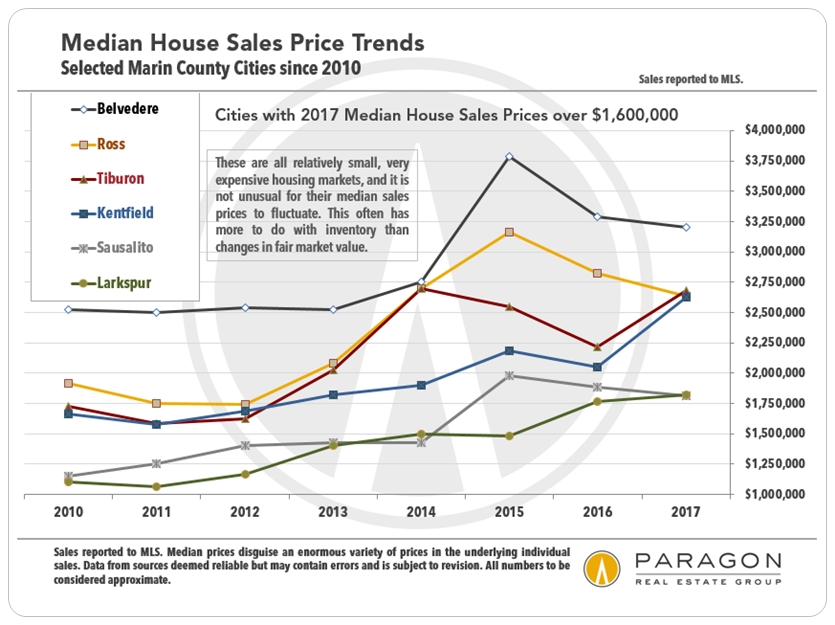
In the most expensive communities, median sales prices sometimes bounce around without great meaningfulness due to the quantities of sales being relatively low, and to the very wide range of home sales prices. That said, it is also true that the greatest pressure of buyer demand in recent years has been in the more affordable home segments - affordable by Marin standards - and appreciation in those communities has typically been more consistent since 2015.
Median House Sales Prices by City since 2010
Average Price per Square Foot House Values by City since 2012

Supply & Demand Statistics
Months Supply of Inventory (MSI)
& Average Days on Market (DOM)
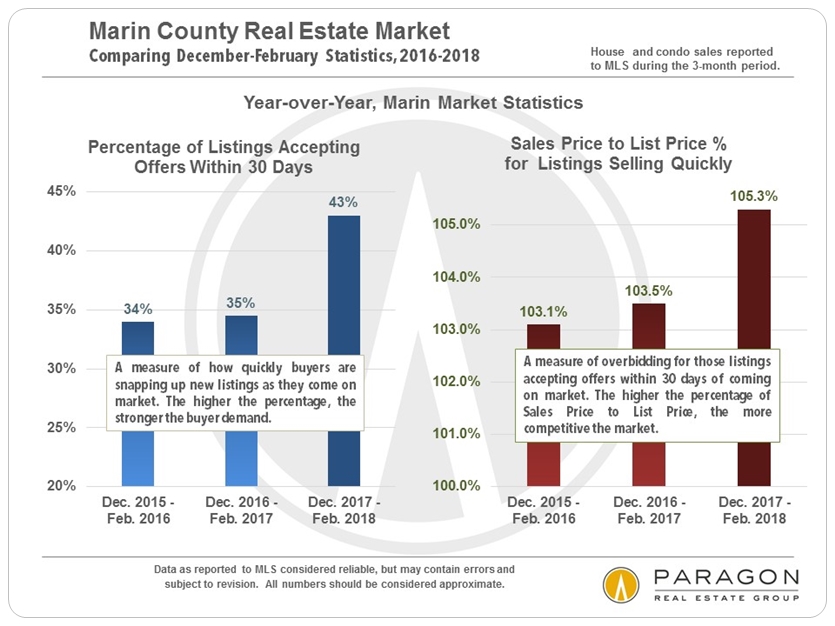
As seen below, as measured by two classic statistics of supply and demand, the market in recent months has certainly not softened in comparison to the last 2 years, and according to Months Supply of Inventory and the Percentage of Listings Selling within 30 Days (the second chart down), it has become appreciably stronger.

Listings Selling within 30 Days Year-over-Year Comparisons
Active Listings on Market
by Month & by City
This next chart illustrates both the seasonality of the market and the size of the respective city markets in Marin County. We are just now entering the time of year when inventory swells to fuel the spring selling season. The 3 biggest home markets are San Rafael, Novato and Mill Valley. Tiburon is a smaller market, but now constitutes the biggest luxury home market in the county. Some Marin markets - such as in Belvedere, Ross, Kentfield and Larkspur - are very small, but very expensive.

Additional Chart: Marin Sales Volumes by City & Town
Sales, Price Reductions
& Listing That Do Not Sell
General Market Listings under $2m
The last 12 months have been a strong market in Marin real estate, and the great majority of sales under $2m sold very quickly, and averaged a sales price over asking price. Those listings that had to go through price reductions before selling spent an average of 9 weeks longer on the market. And then for every 8 to 9 listings that sold, 1 listing expired and was withdrawn from the market, typically because buyers deemed the property overpriced. This is a low ratio of listings that do not sell.

Marin Luxury Home Market
Number of New Listings Coming on Market
& Number of Active Luxury Listings by City
Just as in San Francisco, the luxury home market in Marin is fiercely seasonal, with the market slowly waking up in the first two months of the year; soaring in spring, the dominant period for high-end listings and sales; slowing way down for the mid-late summer doldrums; spiking back up for the short, intense autumn selling season; and finally plunging for the winter holidays.


Additional Chart: Marin 2017 Luxury Home Sales by City
Luxury Home Sales, Price Reductions
& Listings That Do Not Sell
This chart illustrates the difference between high-end listings the market deems appealing and fairly priced - on average, selling quickly for full list price - and those that have to go through price reductions prior to selling (on average, an extra 14 weeks on the market), and then those that do not sell at all, but expire and withdrawn from the market. The ratio of listings that do not sell - 1 expired listing for every 3 that sold - is much higher in the luxury segment than in the general market, and this has everything to do with both demand and pricing (or overpricing).

Rising Mortgage Interest Rates
Short-Term Trends
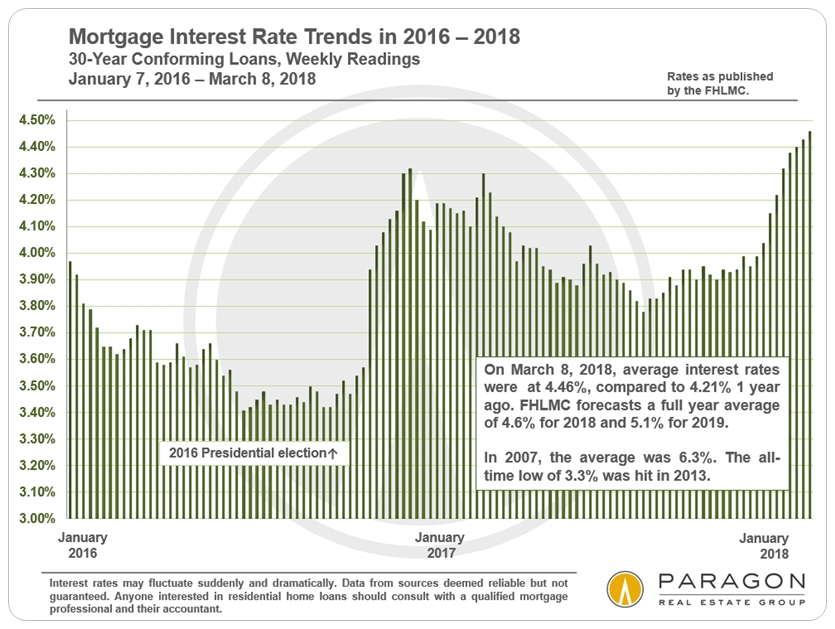
Long-Term Trends

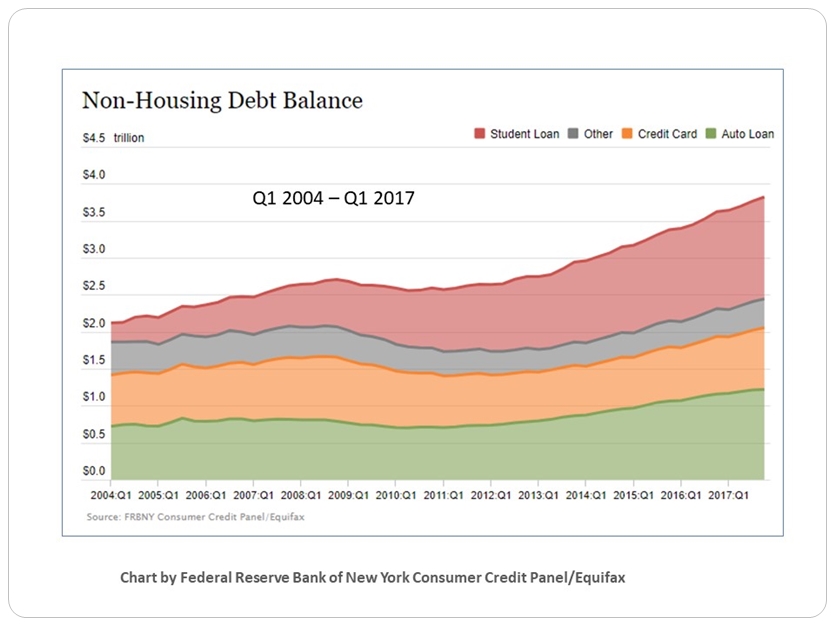
Debt in America
One of the macro-economic factors of concern is that debt levels, of virtually every kind, are hitting new highs in the country (and in the world). This has been heavily subsidized by the historically low interest rates prevailing in recent years, but rates appear to be headed upward, and increasing debt often plays a big role in market cycles.
Debt Taken On to Invest in Financial Markets
(Often a Sign of Investor Over-Exuberance)

Household Non-Housing Debt
Credit Cards, Student Loans, Car Financing
Household Mortgage Debt Service Ratio
The amount of total mortgage debt in the country is now about the same as at its last peak in 2008 (not illustrated on this chart), but because of the plunge in interest rates since then, the ratio of mortgage debt service to disposable income was close to an all-time low in mid-2017. Interest rates have been rising since then, but are still about 30% lower than in 2007. The good news is that so much of mortgage debt in America is now in fixed-rate loans at very low interest rates, which adds much stability to economic conditions, a stability grievously lacking at the time of the 2008 financial markets crash.
