
San Francisco Bay Area
Real Estate Markets
Covering San Francisco, Marin, Alameda, Contra Costa, San Mateo, Santa Clara, Sonoma, Napa & Solano Counties
Median home prices, appreciation rates, luxury home markets,
demographics and other market factors, conditions & trends
Updated February 2018
Bay Area 2017 Median Condo Sales Prices

One cannot draw many conclusions regarding the new year market by looking at January data, whose low volume of sales mostly reflects offers accepted in December, however so far, it appears that the low-inventory/ strong-buyer-demand dynamic is continuing in 2018. One recurring situation in recent years is that buyers jump back into the market in January in larger numbers than sellers getting their homes listed to sell - setting up a mismatch between supply and demand. Typically, many more listings will start pouring onto the market in February and March, and a much better idea regarding where the market is heading in 2018 will be possible once spring selling season data starts coming in.
Since questions constantly arise as to how one development or another is affecting or may affect Bay Area real estate markets - new tax laws, the high-tech boom, interest rates, financial markets, new home construction, climate change, and so on - our chief market analyst has made an attempt to identify and quantify the factors currently at play: Positive & Negative Factors in Bay Area Real Estate Markets
Year-over-Year Home Price Appreciation Rates
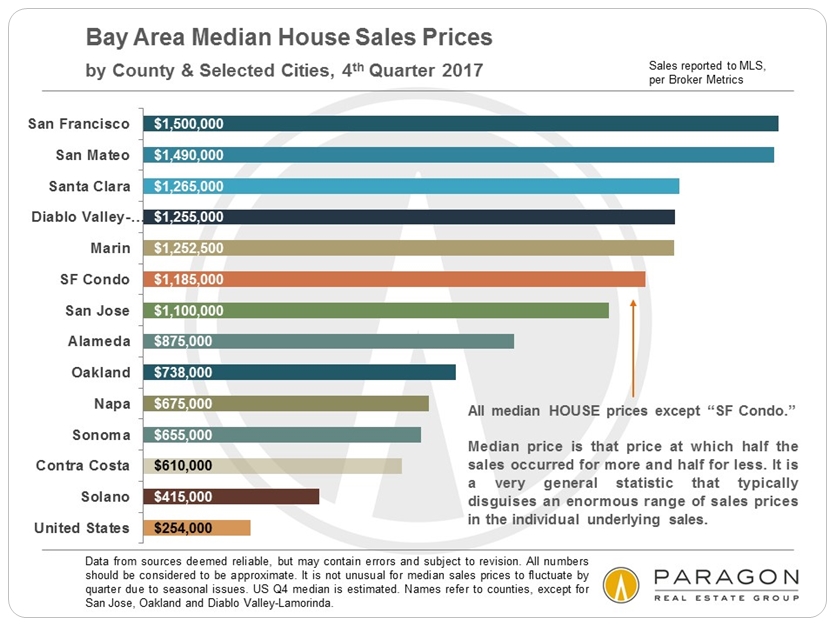
Comparing 2017 Median Sales Prices to 2016 Prices

Average Dollar per Square Foot Values
& What You Get for $1 Million in the Bay Area

Your great aunt gives you a check for a million dollars to buy a home, so you go down to the real estate store to fill your cart. Below are some examples of how much home you would get for your money at 2017 average dollar per square foot rates: In Palo Alto, you could buy 626 square feet of home, and in Vallejo, 3817 square feet, with many other options in between.

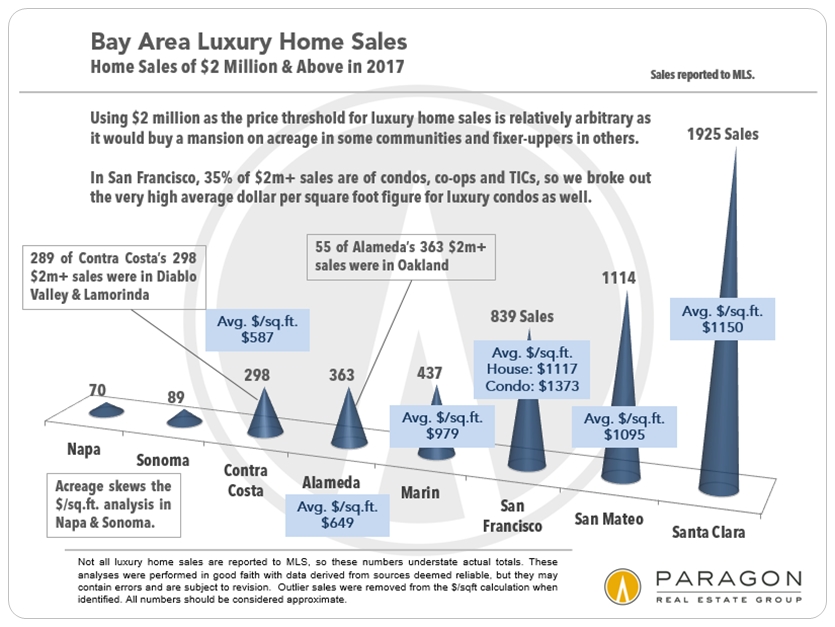
Bay Area Luxury Home Markets
Though San Francisco is a major player in luxury home sales, Silicon Valley - Santa Clara & San Mateo Counties together - has over 3.5 times as many homes selling for $2m and above. All 3 counties have similar average dollar per square foot house values in this high-price category. SF dominates the luxury condo market, and these condos, on average, sell at the highest per square foot values. Marin, Alameda and central Contra Costa Counties have smaller luxury home segments, but you start to get more for your money.
Calculating luxury markets by the top 10% of sales, the thresholds for the luxury designation vary widely: For example, in Sonoma, the threshold is about $1,125,000 for houses, while in San Francisco, it is about $3 million.
Market Dynamics Overviews

The decline in active listings available to purchase has played a significant role in pressurizing the market in recent years, especially as buyer demand has increased over the same period during which supply has dropped.

Since median sales prices are so often quoted and compared, it adds context to look at the average size of houses in the different markets. (Comparing median prices to average sizes is not ideal, but you get the idea.)

New Housing Construction
This chart below from the November 2017 Housing Inventory Report issued by the SF Planning Department is for 2016, but illustrates how new housing construction in Alameda County has recently accelerated ahead of San Francisco and Santa Clara.

Days on Market, Overbidding Asking Prices
& Months Supply of Inventory


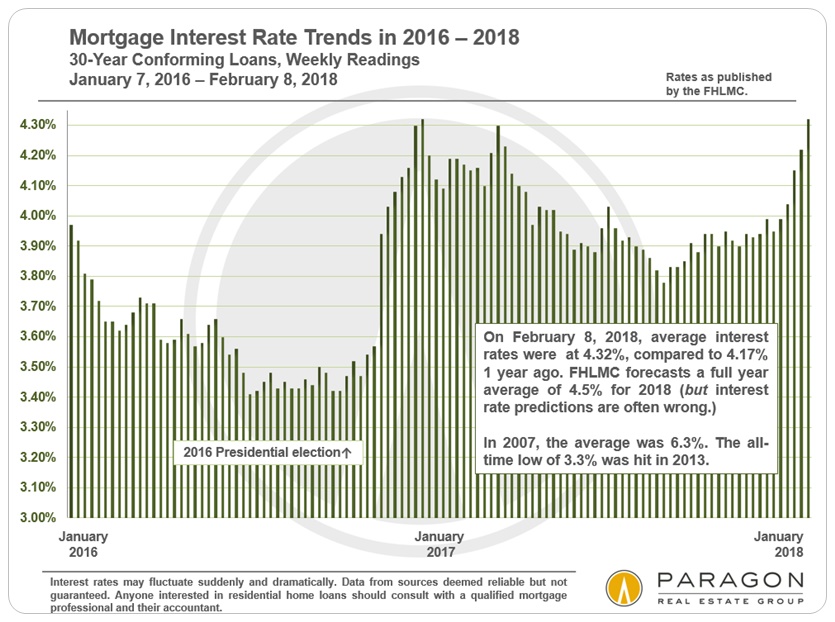
Interest Rate Trends
Interest rate changes will certainly be one of the main factors to keep an eye on in 2018, as they play a huge role in housing affordability.
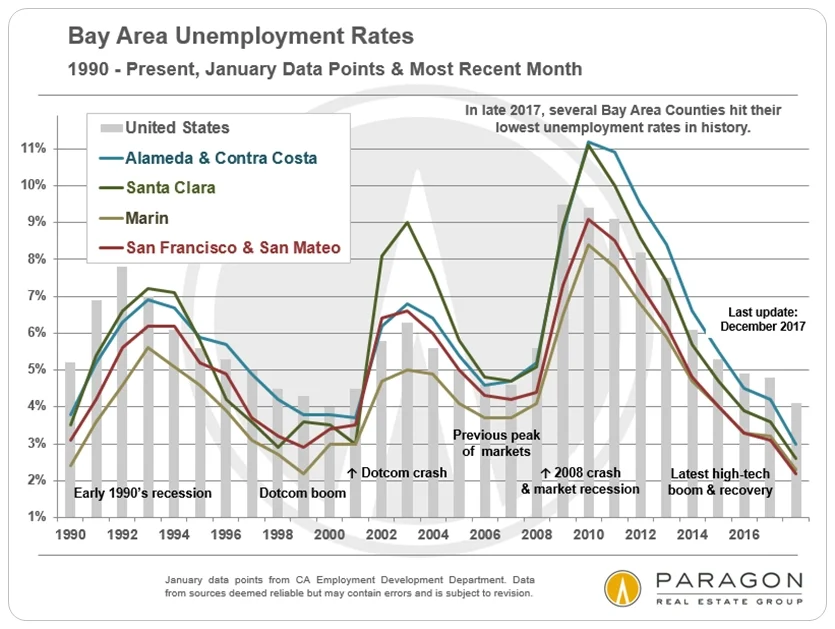
Bay Area Unemployment Rate Trends
Bay Area Housing Affordability Trends
The CAR Housing Affordability Index, of which the trend lines since 1991 are charted below, estimates the percentage of households who can afford to purchase a median priced house in their county, based on a 20% downpayment. The big factors in this analysis are prevailing household incomes, interest rates, and, of course, quarterly median house sales prices. It should be noted that half of home sales are, by definition, below the median sales price, and that if one included condos (typically much cheaper than houses) in the equation, that would add substantially to affordability percentages.
For Q1 2018, the Index will attempt to factor in the effects of the new federal income tax law limiting mortgage interest, property tax and state income tax deductions, which will presumably reduce affordability percentages further. As seen below, many Bay Area counties are already getting close to historic lows, clearly one of our biggest social and economic challenges.

Bay Area County-to-County Migration
Though people from all over the country and world migrate to and from the Bay Area, the greatest flow is actually between the local counties themselves. In net migration numbers, amid all the back and forth, people are, generally speaking, flowing from the core, most expensive counties to adjacent, somewhat less expensive counties, and then to even more affordable counties outside the inner Bay Area. However, the inner core counties, where the high-tech boom has been most concentrated, attract significant immigration from outside the Bay Area, state and U.S., which is why their population numbers have continued to grow. Note: This chart does not include Santa Clara County, though much of its migration patterns can be seen in the data of the other counties.

U.S. Metro Area to Metro Area Migration
This chart pertains to immigration in and out of the 5-county San Francisco metro area, which does not include Santa Clara to its south. Between U.S. metro areas, more people are leaving the SF metro than arriving, but that deficit has been more than made up for by substantial numbers of foreign immigrants. These numbers, however, pre-date the much more hostile view of immigration by the current administration, so we will have to wait and see what effects derive from that change. Looking at net metro-area migration, more people come to the SF metro area from Santa Clara County, Southern California, New York, Chicago and Boston. And more people leave the SF metro area to go to other (less expensive) CA counties east and north of the Bay Area, and to metro areas in Texas, Nevada, Oregon and Washington State. The exodus is made up of both people changing jobs, and retirees, though they tend to go to different places.

If you want to read about state to state migration patterns, our recent article is here: California Migration Trends
These analyses were made in good faith with data from sources deemed reliable, but may contain errors and are subject to revision. It is not our intent to convince you of a particular position, but to attempt to provide straightforward data and analysis, so you can make your own informed decisions. Median and average statistics are enormous generalities: There are hundreds of different markets in the Bay Area, each with its own unique dynamics. Median prices can be and often are affected by other factors besides changes in fair market value, and longer term trends are much more meaningful than short-term. It is impossible to know how median prices apply to any particular home without a specific comparative market analysis. All numbers in this report are to be considered approximate. Copyright Paragon Real Estate Group 2018
© 2018 Paragon Real Estate Group