
The Marin County Real Estate Market
Looking Back on 2017 & Forward to 2018
January 2018 Report
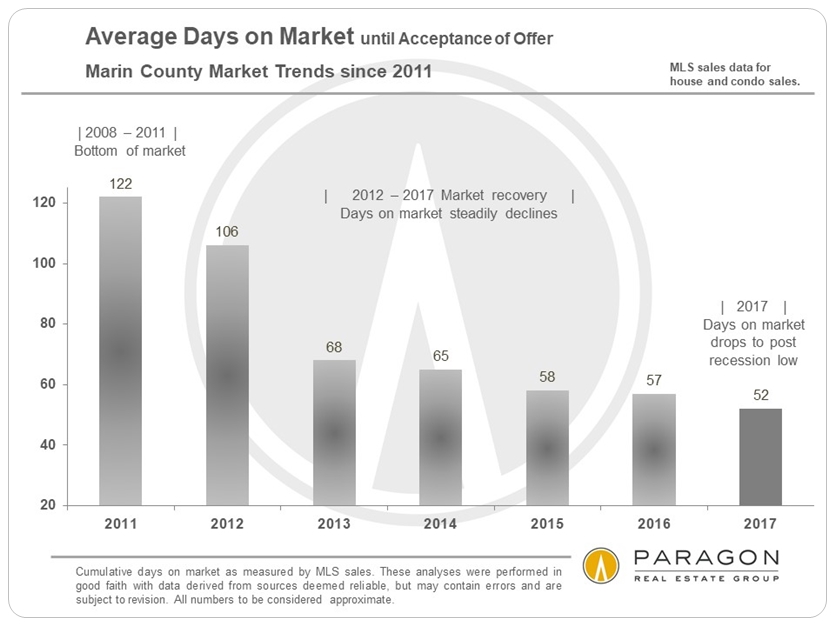
Another strong year in real estate, with continued median home price appreciation in Marin, and indeed throughout the Bay Area.


The chart below, based on CoreLogic S&P Case-Shiller Index data, tracks general price appreciation trends of house in the upper third of prices in the 5-county SF Metro Area (such as those mostly found in SF, Marin, San Mateo and Diablo Valley-Lamorinda). Case-Shiller does not base their calculations on median sales price changes but uses its own proprietary algorithm. This chart has been simplified to only reflect percentage increases and decreases from various points in real estate cycles. Since it covers 5 counties, it is a very generalized illustration.

Moving into 2018, there are a lot of spinning plates in the air - local, state, national and international factors that could affect markets. 2017 saw real estate markets surge and financial markets soar. After some cooling from mid-2015 to mid-2016, the Bay Area high-tech economy surged back into high speed, with companies leasing enormous spaces in newly built office buildings - which they will presumably fill with new hires. Unemployment rates have flirted with historic lows, and 2018 may see some major local IPOs, which could create great quantities of new wealth. The Bay Area still has probably the most dynamic, innovation-fueled economy in the world and indisputably remains among the great metro areas on the planet - but there are social, economic, political and environmental challenges looming as well.
Congress delivered an unpleasant holiday present to many Bay Area residents in the form of federal tax law changes limiting the deductibility of mortgage interest and state and local taxes. The effect of these changes make living in an already high cost-of-living area more costly for many residents, and also reduce some of the financial incentives of homeownership, especially for more expensive homes. Predictions on the effect of these tax changes on local housing markets and the business environment range from one extreme (economic devastation) to the other (shrug), and the state legislature is currently working on bills that might blunt the negative financial impacts. It is too early to guess how it will all play out. We live in interesting times.
This report will review real estate trends in 2017, and some of the economic factors that impacted them. Most of the charts are self-explanatory, so we have kept the text to a minimum. Towards the end is an extensive analysis of home prices by city and by bedroom count.


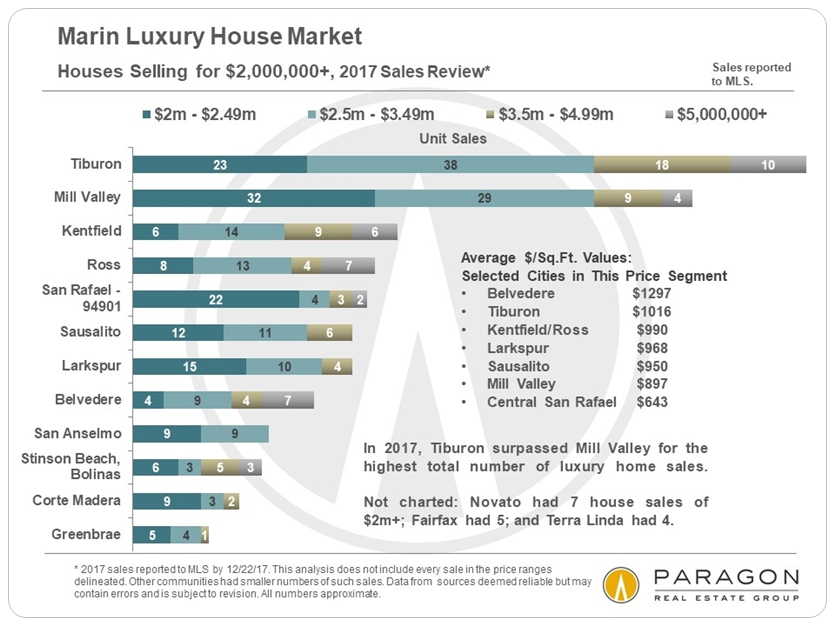
Marin Luxury Homes Market

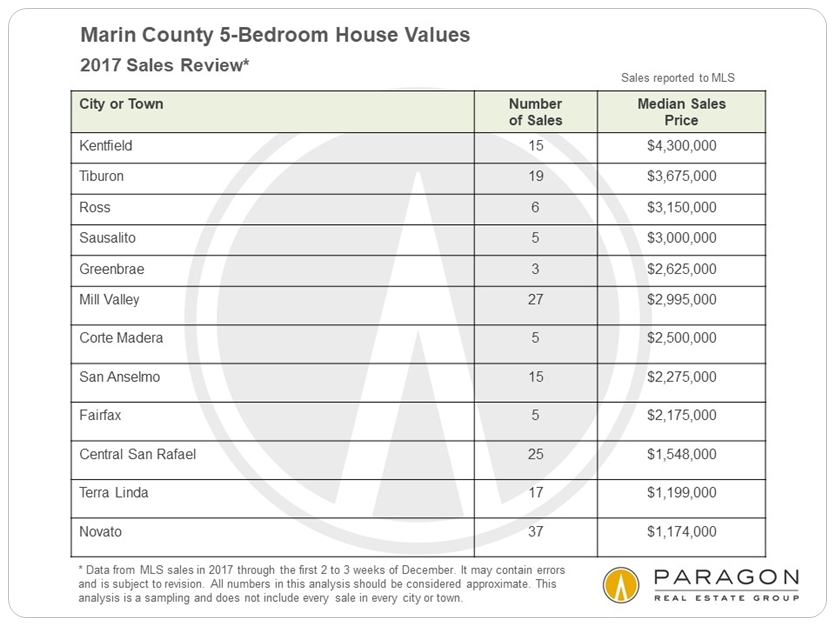
Main County Home Prices by City
& Bedroom Count
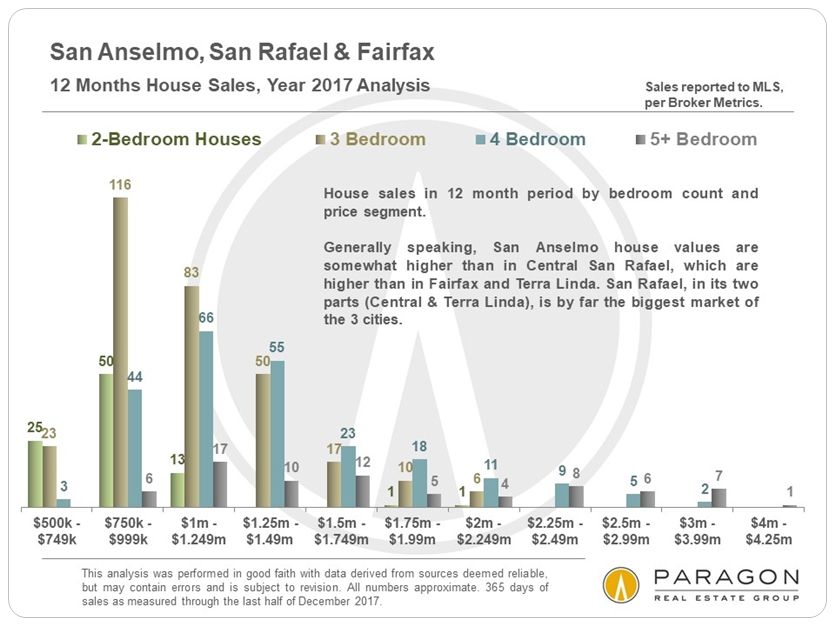
Best Places to Look for a Home in Your Price Range

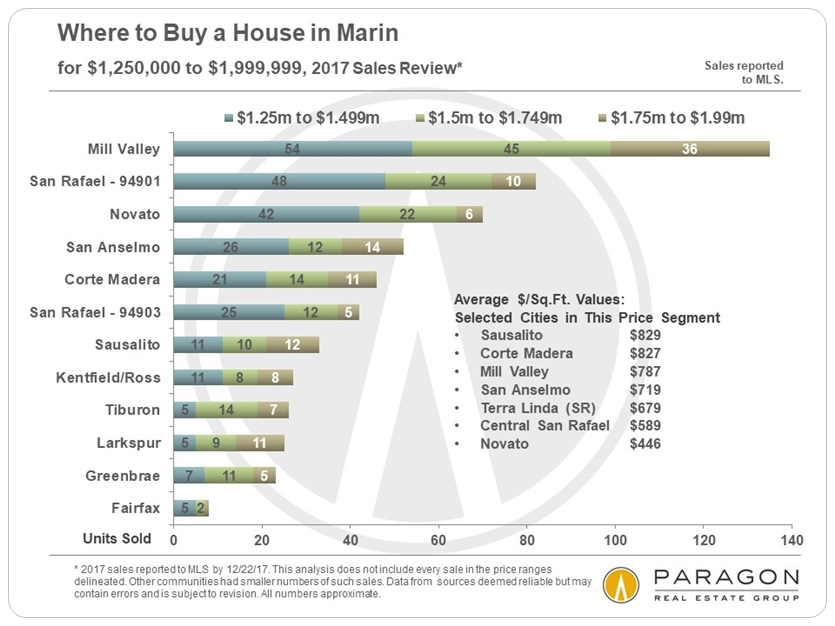


Drilling down beyond the general statistic of median sales price, these charts give a better idea of how likely one is to find a home of a particular size within a price segment in specific Marin County cities.


It is impossible to know how median and average value statistics apply to any particular home without a specific, tailored, comparative market analysis. In real estate, the devil is always in the details.
These analyses were made in good faith with data from sources deemed reliable, but may contain errors and are subject to revision. It is not our intent to convince you of a particular position, but to attempt to provide straightforward data and analysis, so you can make your own informed decisions. Median and average statistics are enormous generalities: There are hundreds of different markets in the Bay Area, each with its own unique dynamics. Median prices and average dollar per square foot values can be and often are affected by other factors besides changes in fair market value. Longer term trends are much more meaningful than short-term. Late-reported MLS activity may change certain statistics to some small degree.
© 2018 Paragon Real Estate Group