
The Marin County Real Estate Market
Preliminary Indications of Direction for the 2017 Market
April 2017 Report
Year-over-Year Comparisons of Q1 Statistics
Chart 1: General Market Overview

Chart 2: Luxury Home Market Overview
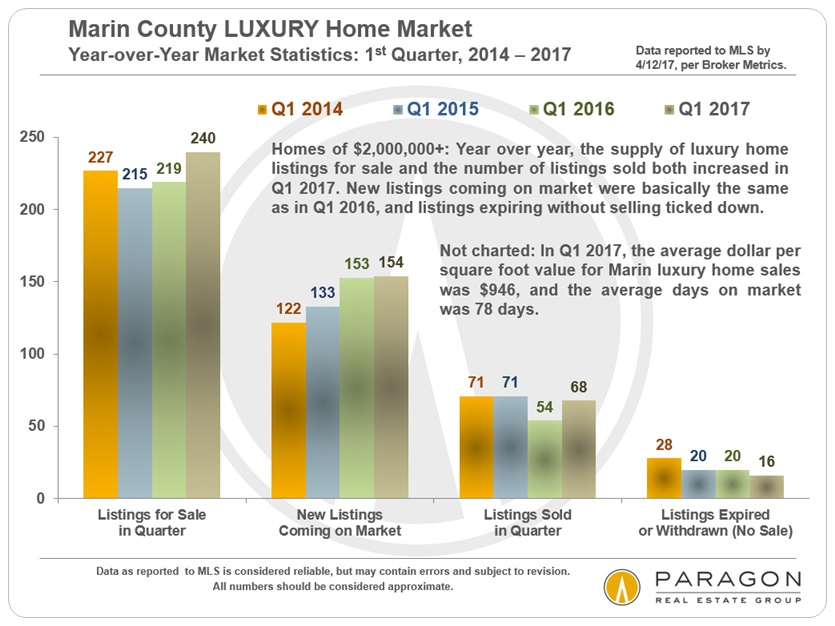
Q1 is the quarter of the year with the least number of closed sales, so too much should not be made of its data, but we have summarized annual Q1 dynamics for the past 4 years in the 2 charts above. In the general residential market (chart 1), the inventory of listings available to buy remained constrained in Q1 2017, and median sales prices for both condos and houses in Marin were significantly higher than in Q1 2016. The activity in the high-end home market also compares favorably with the same period last year. The number of active luxury home listings increased, but so did sales volume.
Much more will be known regarding the direction of the 2017 market after Q2 data is in: March through June is the most active selling season of the year. Remember that sales data is what is called a lagging indicator: Transactions negotiated in one month typically do not close sale until 4 to 6 weeks later.
Market Seasonality
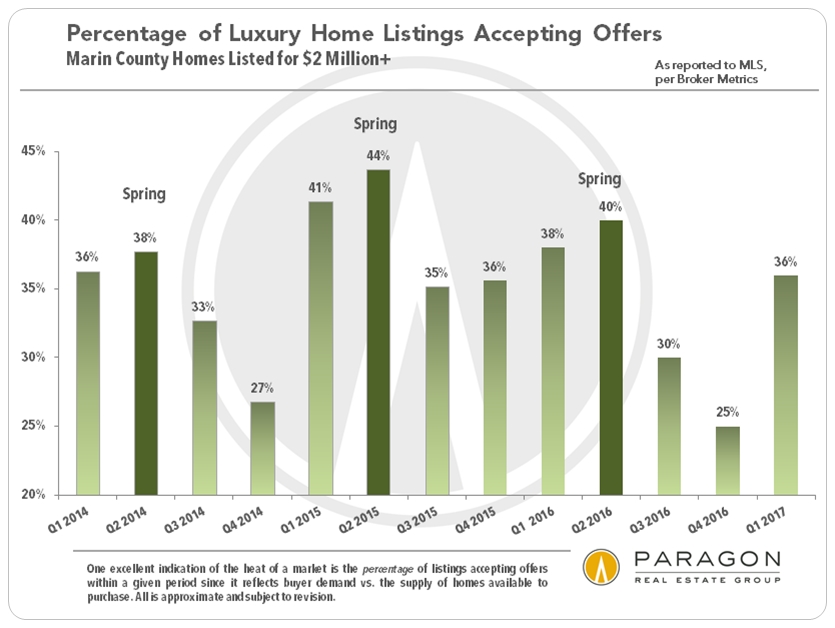
Supply & Demand Statistics
Real estate is greatly impacted in a number of ways by seasonality. As illustrated below, by almost every metric, spring is typically the hottest market of the year.
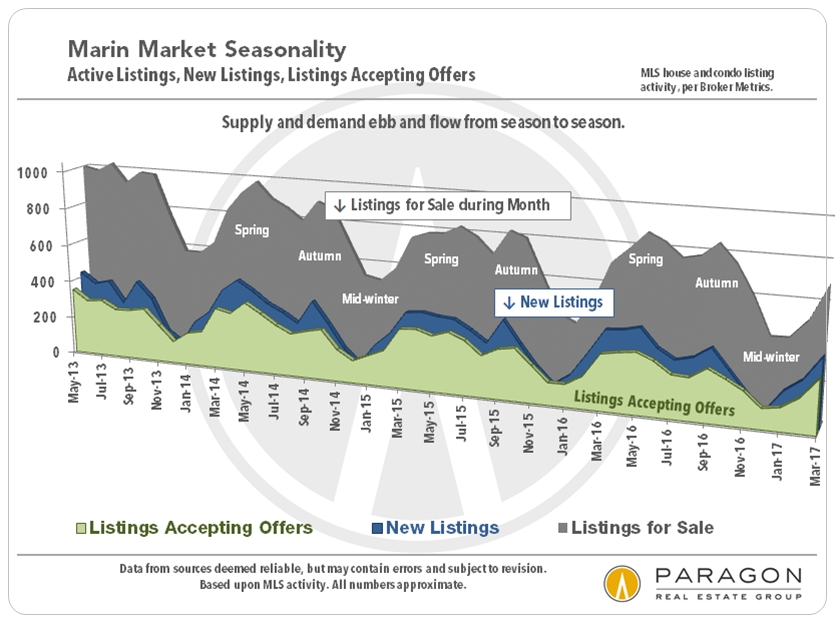
Months supply of inventory (MSI) and average days on market are classic measurements of the heat of the market. The lower the MSI reading, the stronger the demand as compared to the supply of homes available to buy: The MSI in Marin for non-luxury homes has generally remained very low in recent years. MSI for luxury homes fluctuates much more by season, but, as is common, it has dropped significantly as we enter the spring selling season. Of course, the strength of buyer demand also affects how quickly listings will sell, as illustrated in the average days on market chart.


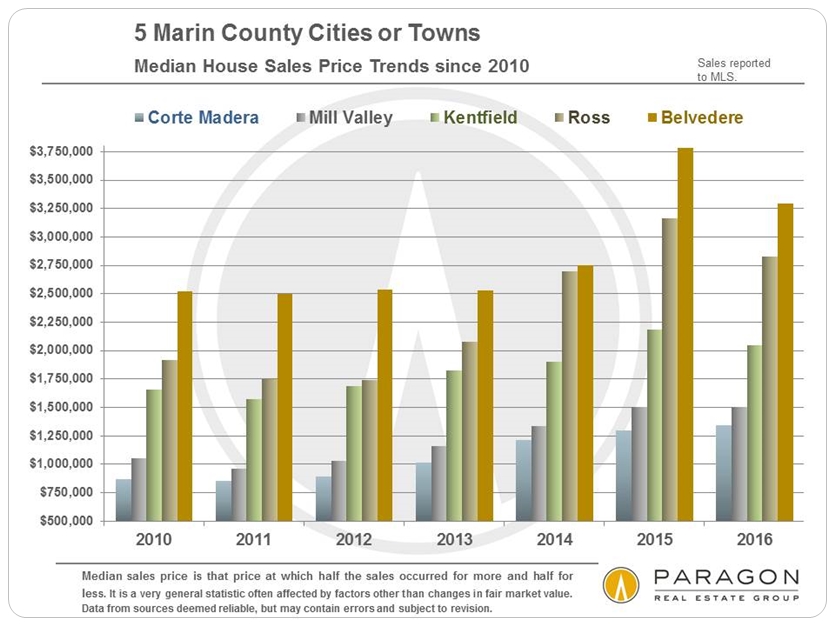
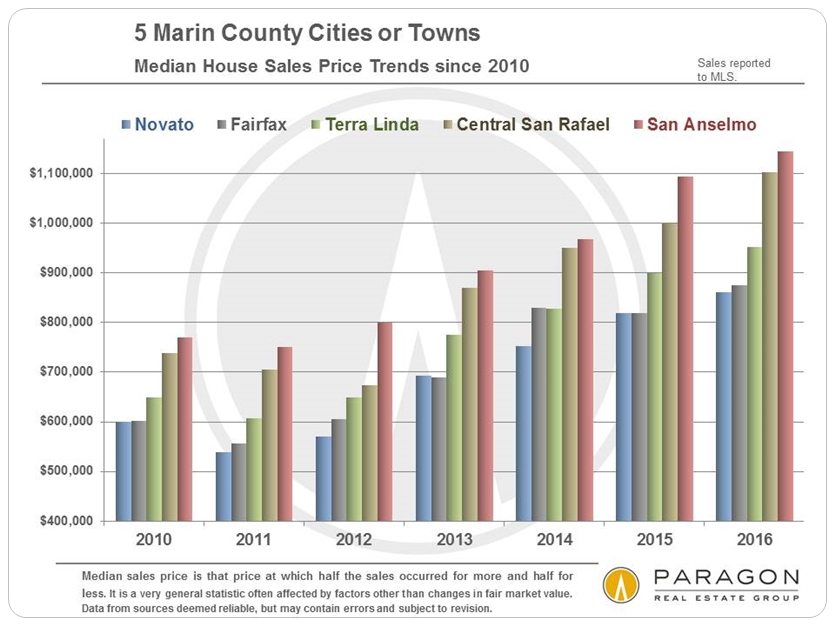
Median House Sales Price Trends
10 Selected Marin County Cities & Towns, since 2010
Note that outsized jumps up and down in median and average value statistics in very expensive communities with small numbers of sales (such as Belvedere and Ross) often have more to do with changes in inventory than changes in fair market value. However, generally speaking, the highest-priced communities saw a flattening or declines in median sales prices in 2016, while prices in more affordable areas increased. This has been a relatively common dynamic around the Bay Area in the past year.
It is impossible to know how median and average value statistics apply to any particular home without a comparative market analysis tailored to its specific location, condition, size, amenities and visual appeal.
If you would like value trend data on a Marin town or city not included in this sampling, please let me know.
Average Dollar per Square Foot Values
10 Selected Marin County Cities & Towns, since 2012


When one steps back to look at annual trends, the picture usually becomes clearer than with often fluctuating monthly or quarterly data. We looked at annual trends by a variety of classic real estate statistical measures in our March newsletter, which can be found further down on this webpage.
Average House Size
Though there are many important factors at play, average house size unsurprisingly plays a big part in both median sales prices and average dollar per square foot values. The average square footage of a house in Ross or Belvedere is more than double that of a house in Fairfax.

Interest Rates
Constantly shifting economic and political factors continue to affect rates: Mortgage interest rates are significantly up since the election, fluctuating up and down since the year began, but still far below historical norms. This is a factor everyone is watching carefully because of its potential impact on affordability, already a big issue in the Bay Area.

If you have any questions or comments regarding this report, or if assistance can be provided in any other way, please let me know.
These analyses were made in good faith with data from sources deemed reliable, but may contain errors and are subject to revision. It is not our intent to convince you of a particular position, but to attempt to provide straightforward data and analysis, so you can make your own informed decisions. Median and average statistics are enormous generalities: There are hundreds of different markets in the Bay Area, each with its own unique dynamics. Median prices and average dollar per square foot values can be and often are affected by other factors besides changes in fair market value. Longer term trends are much more meaningful than short-term.
© 2017 Paragon Real Estate Group